anti integrin β5 Search Results


90
Miltenyi Biotec anti integrin β5
Anti Integrin β5, supplied by Miltenyi Biotec, used in various techniques. Bioz Stars score: 90/100, based on 1 PubMed citations. ZERO BIAS - scores, article reviews, protocol conditions and more
https://www.bioz.com/result/anti integrin β5/product/Miltenyi Biotec
Average 90 stars, based on 1 article reviews
anti integrin β5 - by Bioz Stars, 2026-03
90/100 stars
  Buy from Supplier

90
Becton Dickinson alexa fluor ® 647-conjugated anti-β5 integrin ab
a Representative confocal images of αvβ5 <t>integrin</t> + CD4 + Foxp3 + T cells (left) and NRP-1 + CD4 + Foxp3 + T cells (right) in the PDAC tissue of KPC-derived orthotopic PDAC mice. Arrows indicate αvβ5 integrin + or NRP-1 + Tregs (magenta). Green, CD4; red, Foxp3; blue, DAPI. The boxed areas are magnified. Scale bars, 20 μm. b A representative flow cytometry analysis showing the proportion of CD8 + T cells, CD4 + CD25 neg T cells (non-Tregs), CD4 + CD25 + Tregs that are positive for αvβ5 integrin, NRP-1, or both in KPC-derived orthotopic PDAC tumors. c Bar diagrams that summarize the findings from ( b ) and Supplementary Fig. 10. n = 5 per group. d Representative confocal images of αvβ5 integrin + Foxp3 + CD4 + Tregs and NRP-1 + CD4 + Tregs in human PDAC and spleen. Magenta, αvβ5 integrin or NRP-1; green, CD4; red, Foxp3; blue, DAPI. Scale bars, 20 μm. e The number of αvβ5 integrin-positive and NRP-1-positive CD4 + Foxp3 + Tregs was counted under a confocal microscope and the % positivity was calculated. n = 3. Statistical analysis, one-way ANOVA ( c ) and Welch’s test ( e ); p = 0.0003 ( c, left, CD8 vs Tregs), p = 0.0169 ( c, left, Non-Tregs vs Tregs), p = 0.0002 ( c, left, Tregs vs Spleen Tregs), p = 0.0003 ( c, center, CD8 vs Tregs), p = 0.0123 ( c, center, Non-Tregs vs Tregs), p < 0.0001 ( c, center, Tregs vs Spleen Tregs), p = 0.0008 ( c, right, CD8 vs Tregs), p = 0.0109 ( c, right, Non-Tregs vs Tregs), p = 0.0019 ( c, right, Tregs vs Spleen Tregs), p = 0.0071 ( e, left), p = 0.4858 ( e, right). Error bars, mean ± standard error. * p < 0.05; ** p < 0.01; *** p < 0.001; **** p < 0.0001; N.S., not significant.
Alexa Fluor ® 647 Conjugated Anti β5 Integrin Ab, supplied by Becton Dickinson, used in various techniques. Bioz Stars score: 90/100, based on 1 PubMed citations. ZERO BIAS - scores, article reviews, protocol conditions and more
https://www.bioz.com/result/alexa fluor ® 647-conjugated anti-β5 integrin ab/product/Becton Dickinson
Average 90 stars, based on 1 article reviews
alexa fluor ® 647-conjugated anti-β5 integrin ab - by Bioz Stars, 2026-03
90/100 stars
  Buy from Supplier

90
Abnova rabbit anti-integrin β5
a Representative confocal images of αvβ5 <t>integrin</t> + CD4 + Foxp3 + T cells (left) and NRP-1 + CD4 + Foxp3 + T cells (right) in the PDAC tissue of KPC-derived orthotopic PDAC mice. Arrows indicate αvβ5 integrin + or NRP-1 + Tregs (magenta). Green, CD4; red, Foxp3; blue, DAPI. The boxed areas are magnified. Scale bars, 20 μm. b A representative flow cytometry analysis showing the proportion of CD8 + T cells, CD4 + CD25 neg T cells (non-Tregs), CD4 + CD25 + Tregs that are positive for αvβ5 integrin, NRP-1, or both in KPC-derived orthotopic PDAC tumors. c Bar diagrams that summarize the findings from ( b ) and Supplementary Fig. 10. n = 5 per group. d Representative confocal images of αvβ5 integrin + Foxp3 + CD4 + Tregs and NRP-1 + CD4 + Tregs in human PDAC and spleen. Magenta, αvβ5 integrin or NRP-1; green, CD4; red, Foxp3; blue, DAPI. Scale bars, 20 μm. e The number of αvβ5 integrin-positive and NRP-1-positive CD4 + Foxp3 + Tregs was counted under a confocal microscope and the % positivity was calculated. n = 3. Statistical analysis, one-way ANOVA ( c ) and Welch’s test ( e ); p = 0.0003 ( c, left, CD8 vs Tregs), p = 0.0169 ( c, left, Non-Tregs vs Tregs), p = 0.0002 ( c, left, Tregs vs Spleen Tregs), p = 0.0003 ( c, center, CD8 vs Tregs), p = 0.0123 ( c, center, Non-Tregs vs Tregs), p < 0.0001 ( c, center, Tregs vs Spleen Tregs), p = 0.0008 ( c, right, CD8 vs Tregs), p = 0.0109 ( c, right, Non-Tregs vs Tregs), p = 0.0019 ( c, right, Tregs vs Spleen Tregs), p = 0.0071 ( e, left), p = 0.4858 ( e, right). Error bars, mean ± standard error. * p < 0.05; ** p < 0.01; *** p < 0.001; **** p < 0.0001; N.S., not significant.
Rabbit Anti Integrin β5, supplied by Abnova, used in various techniques. Bioz Stars score: 90/100, based on 1 PubMed citations. ZERO BIAS - scores, article reviews, protocol conditions and more
https://www.bioz.com/result/rabbit anti-integrin β5/product/Abnova
Average 90 stars, based on 1 article reviews
rabbit anti-integrin β5 - by Bioz Stars, 2026-03
90/100 stars
  Buy from Supplier

90
Abnova mouse anti-integrin β5
a Representative confocal images of αvβ5 <t>integrin</t> + CD4 + Foxp3 + T cells (left) and NRP-1 + CD4 + Foxp3 + T cells (right) in the PDAC tissue of KPC-derived orthotopic PDAC mice. Arrows indicate αvβ5 integrin + or NRP-1 + Tregs (magenta). Green, CD4; red, Foxp3; blue, DAPI. The boxed areas are magnified. Scale bars, 20 μm. b A representative flow cytometry analysis showing the proportion of CD8 + T cells, CD4 + CD25 neg T cells (non-Tregs), CD4 + CD25 + Tregs that are positive for αvβ5 integrin, NRP-1, or both in KPC-derived orthotopic PDAC tumors. c Bar diagrams that summarize the findings from ( b ) and Supplementary Fig. 10. n = 5 per group. d Representative confocal images of αvβ5 integrin + Foxp3 + CD4 + Tregs and NRP-1 + CD4 + Tregs in human PDAC and spleen. Magenta, αvβ5 integrin or NRP-1; green, CD4; red, Foxp3; blue, DAPI. Scale bars, 20 μm. e The number of αvβ5 integrin-positive and NRP-1-positive CD4 + Foxp3 + Tregs was counted under a confocal microscope and the % positivity was calculated. n = 3. Statistical analysis, one-way ANOVA ( c ) and Welch’s test ( e ); p = 0.0003 ( c, left, CD8 vs Tregs), p = 0.0169 ( c, left, Non-Tregs vs Tregs), p = 0.0002 ( c, left, Tregs vs Spleen Tregs), p = 0.0003 ( c, center, CD8 vs Tregs), p = 0.0123 ( c, center, Non-Tregs vs Tregs), p < 0.0001 ( c, center, Tregs vs Spleen Tregs), p = 0.0008 ( c, right, CD8 vs Tregs), p = 0.0109 ( c, right, Non-Tregs vs Tregs), p = 0.0019 ( c, right, Tregs vs Spleen Tregs), p = 0.0071 ( e, left), p = 0.4858 ( e, right). Error bars, mean ± standard error. * p < 0.05; ** p < 0.01; *** p < 0.001; **** p < 0.0001; N.S., not significant.
Mouse Anti Integrin β5, supplied by Abnova, used in various techniques. Bioz Stars score: 90/100, based on 1 PubMed citations. ZERO BIAS - scores, article reviews, protocol conditions and more
https://www.bioz.com/result/mouse anti-integrin β5/product/Abnova
Average 90 stars, based on 1 article reviews
mouse anti-integrin β5 - by Bioz Stars, 2026-03
90/100 stars
  Buy from Supplier

90
MyBiosource Biotechnology anti- integrin β5 antibody
(A-F) Effects of inhibiting αv <t>integrin</t> function with siRNA knockdown (A and B or)specific monoclonal antibodies (C-F) and on the endocytosis (A, C, D) and cell-association (B, E, F) of serum-coated C . glabrata . (G and H) Inhibition of gC1qR (with monoclonal antibody 74.5.2) and αv integrins has an additive effect on decreasing the endocytosis (G) but not cell-association of serum-coated C . glabrata (H). Results are the mean ± SD of 3 experiments, each performed in triplicate. Orgs/HPF, organisms per high power field; ns, not significant; * P < 0.05, ** P < 0.01, *** P < 0.001, **** P < 0.0001 by ANOVA with the Dunnett’s test for multiple comparisons (A, B, G, H) or the Student’s t-test (C-F).
Anti Integrin β5 Antibody, supplied by MyBiosource Biotechnology, used in various techniques. Bioz Stars score: 90/100, based on 1 PubMed citations. ZERO BIAS - scores, article reviews, protocol conditions and more
https://www.bioz.com/result/anti- integrin β5 antibody/product/MyBiosource Biotechnology
Average 90 stars, based on 1 article reviews
anti- integrin β5 antibody - by Bioz Stars, 2026-03
90/100 stars
  Buy from Supplier

90
Meridian Bioscience anti-human β5 integrin
CaFak and integrin-like receptors colocalize into the focal adhesions in C. albicans yeast cells adherent to VN. Confocal laser-scanning microscopy analysis on permeabilized C. albicans yeast cells with anti-Fak <t>COOH,</t> <t>anti-αv,</t> anti-β3, or anti-β5 integrin rabbit antiserum or anti-Fak NH2 mouse MAb as the primary Ab and FITC-GAR and Texas Red-GAM as second-step Abs. Panels: 3 and 5, C. albicans yeast cells on a bright field; 1 and 2, C. albicans yeast cells incubated with Texas Red-GAM or FITC-GAR, respectively; 4, C. albicans yeast cells stained with anti-Fak COOH and FITC-GAR; 6, merge of images in panels 4 and 5; 7, 10, and 13, C. albicans yeast cells stained with anti-Fak NH2 MAb and Texas Red-GAM; C. albicans yeast cells stained with anti-αv (panel 8), anti-β3 (panel 11), or anti-β5 integrin (panel 14) Ab and FITC-GAR, respectively; 9, 12, and 15, merge of images in panels 7 and 8, 10 and 11, and 13 and 14, respectively. The results are representative of one of three separate experiments. White arrows indicate CaFak localization at focal adhesion sites. Bar, 1 μm.
Anti Human β5 Integrin, supplied by Meridian Bioscience, used in various techniques. Bioz Stars score: 90/100, based on 1 PubMed citations. ZERO BIAS - scores, article reviews, protocol conditions and more
https://www.bioz.com/result/anti-human β5 integrin/product/Meridian Bioscience
Average 90 stars, based on 1 article reviews
anti-human β5 integrin - by Bioz Stars, 2026-03
90/100 stars
  Buy from Supplier

90
Miltenyi Biotec integrin β5 antibody, anti-human, apc, reafinity
CaFak and integrin-like receptors colocalize into the focal adhesions in C. albicans yeast cells adherent to VN. Confocal laser-scanning microscopy analysis on permeabilized C. albicans yeast cells with anti-Fak <t>COOH,</t> <t>anti-αv,</t> anti-β3, or anti-β5 integrin rabbit antiserum or anti-Fak NH2 mouse MAb as the primary Ab and FITC-GAR and Texas Red-GAM as second-step Abs. Panels: 3 and 5, C. albicans yeast cells on a bright field; 1 and 2, C. albicans yeast cells incubated with Texas Red-GAM or FITC-GAR, respectively; 4, C. albicans yeast cells stained with anti-Fak COOH and FITC-GAR; 6, merge of images in panels 4 and 5; 7, 10, and 13, C. albicans yeast cells stained with anti-Fak NH2 MAb and Texas Red-GAM; C. albicans yeast cells stained with anti-αv (panel 8), anti-β3 (panel 11), or anti-β5 integrin (panel 14) Ab and FITC-GAR, respectively; 9, 12, and 15, merge of images in panels 7 and 8, 10 and 11, and 13 and 14, respectively. The results are representative of one of three separate experiments. White arrows indicate CaFak localization at focal adhesion sites. Bar, 1 μm.
Integrin β5 Antibody, Anti Human, Apc, Reafinity, supplied by Miltenyi Biotec, used in various techniques. Bioz Stars score: 90/100, based on 1 PubMed citations. ZERO BIAS - scores, article reviews, protocol conditions and more
https://www.bioz.com/result/integrin β5 antibody, anti-human, apc, reafinity/product/Miltenyi Biotec
Average 90 stars, based on 1 article reviews
integrin β5 antibody, anti-human, apc, reafinity - by Bioz Stars, 2026-03
90/100 stars
  Buy from Supplier

Image Search Results


a Representative confocal images of αvβ5 integrin + CD4 + Foxp3 + T cells (left) and NRP-1 + CD4 + Foxp3 + T cells (right) in the PDAC tissue of KPC-derived orthotopic PDAC mice. Arrows indicate αvβ5 integrin + or NRP-1 + Tregs (magenta). Green, CD4; red, Foxp3; blue, DAPI. The boxed areas are magnified. Scale bars, 20 μm. b A representative flow cytometry analysis showing the proportion of CD8 + T cells, CD4 + CD25 neg T cells (non-Tregs), CD4 + CD25 + Tregs that are positive for αvβ5 integrin, NRP-1, or both in KPC-derived orthotopic PDAC tumors. c Bar diagrams that summarize the findings from ( b ) and Supplementary Fig. 10. n = 5 per group. d Representative confocal images of αvβ5 integrin + Foxp3 + CD4 + Tregs and NRP-1 + CD4 + Tregs in human PDAC and spleen. Magenta, αvβ5 integrin or NRP-1; green, CD4; red, Foxp3; blue, DAPI. Scale bars, 20 μm. e The number of αvβ5 integrin-positive and NRP-1-positive CD4 + Foxp3 + Tregs was counted under a confocal microscope and the % positivity was calculated. n = 3. Statistical analysis, one-way ANOVA ( c ) and Welch’s test ( e ); p = 0.0003 ( c, left, CD8 vs Tregs), p = 0.0169 ( c, left, Non-Tregs vs Tregs), p = 0.0002 ( c, left, Tregs vs Spleen Tregs), p = 0.0003 ( c, center, CD8 vs Tregs), p = 0.0123 ( c, center, Non-Tregs vs Tregs), p < 0.0001 ( c, center, Tregs vs Spleen Tregs), p = 0.0008 ( c, right, CD8 vs Tregs), p = 0.0109 ( c, right, Non-Tregs vs Tregs), p = 0.0019 ( c, right, Tregs vs Spleen Tregs), p = 0.0071 ( e, left), p = 0.4858 ( e, right). Error bars, mean ± standard error. * p < 0.05; ** p < 0.01; *** p < 0.001; **** p < 0.0001; N.S., not significant.

Journal: bioRxiv

Article Title: Tumor-resident regulatory T cells in pancreatic cancer express the αvβ5 integrin as a targetable activation marker

doi: 10.1101/2023.05.24.542137

Figure Lengend Snippet: a Representative confocal images of αvβ5 integrin + CD4 + Foxp3 + T cells (left) and NRP-1 + CD4 + Foxp3 + T cells (right) in the PDAC tissue of KPC-derived orthotopic PDAC mice. Arrows indicate αvβ5 integrin + or NRP-1 + Tregs (magenta). Green, CD4; red, Foxp3; blue, DAPI. The boxed areas are magnified. Scale bars, 20 μm. b A representative flow cytometry analysis showing the proportion of CD8 + T cells, CD4 + CD25 neg T cells (non-Tregs), CD4 + CD25 + Tregs that are positive for αvβ5 integrin, NRP-1, or both in KPC-derived orthotopic PDAC tumors. c Bar diagrams that summarize the findings from ( b ) and Supplementary Fig. 10. n = 5 per group. d Representative confocal images of αvβ5 integrin + Foxp3 + CD4 + Tregs and NRP-1 + CD4 + Tregs in human PDAC and spleen. Magenta, αvβ5 integrin or NRP-1; green, CD4; red, Foxp3; blue, DAPI. Scale bars, 20 μm. e The number of αvβ5 integrin-positive and NRP-1-positive CD4 + Foxp3 + Tregs was counted under a confocal microscope and the % positivity was calculated. n = 3. Statistical analysis, one-way ANOVA ( c ) and Welch’s test ( e ); p = 0.0003 ( c, left, CD8 vs Tregs), p = 0.0169 ( c, left, Non-Tregs vs Tregs), p = 0.0002 ( c, left, Tregs vs Spleen Tregs), p = 0.0003 ( c, center, CD8 vs Tregs), p = 0.0123 ( c, center, Non-Tregs vs Tregs), p < 0.0001 ( c, center, Tregs vs Spleen Tregs), p = 0.0008 ( c, right, CD8 vs Tregs), p = 0.0109 ( c, right, Non-Tregs vs Tregs), p = 0.0019 ( c, right, Tregs vs Spleen Tregs), p = 0.0071 ( e, left), p = 0.4858 ( e, right). Error bars, mean ± standard error. * p < 0.05; ** p < 0.01; *** p < 0.001; **** p < 0.0001; N.S., not significant.

Article Snippet: After removing dead cells with a Dead Cell Removal kit (Miltenyi Biotec), the cells were treated with a PE-conjugated anti-CD25 Ab (Miltenyi Biotec), PE-conjugated anti-CCR8 Ab (eBioscience), and/or Alexa Fluor ® 647-conjugated anti-β5 integrin Ab (clone ALULA; BD Biosciences) combined with an anti-PE or -AF647 magnetic separation technique (Miltenyi Biotec) to enrich for CCR8 + iTregs, αvβ5 integrin + CCR8 + iTregs, or αvβ5 integrin neg CCR8 + iTregs.

Techniques: Derivative Assay, Flow Cytometry, Microscopy

a-e CD4 + T cells isolated from the spleens of healthy C57B6129SF1/J hybrid mice were expanded for 3 days in vitro in the presence of KPC-derived PDAC cells. Flow cytometry was performed for subsequent analyses. ( a ) Expression of αvβ5 integrin and NRP-1 on CD4 + CD25 + Tregs expanded with or without the PDAC cells. n = 4 per group. ( b ) Expression of αvβ5 integrin and NRP-1 on CD4 + CD25 + Tregs and non-Treg CD4 + CD25 neg T cells expanded with the PDAC cells. n = 3 per group. ( c ) FAM-iRGD binding to the non-Tregs (blue line) and Tregs (red line) shown in ( b ). The bar diagram summarizes the median fluorescence intensity (MFI) from 4 independent experiments. ( d ) Dose-dependent inhibition of FAM-iRGD binding by an anti-αvβ5 integrin blocking Ab to Tregs that were expanded in the presence of PDAC cells. Values were normalized against isotype control. n = 3 per group. Statistical analysis was performed between the isotype control and anti-αvβ5 integrin values. ( e ) Tregs and non-Tregs were expanded in the presence of PDAC cells with or without iRGD. Apoptosis was quantified by measuring annexin V and 7-AAD double positive cells by flow cytometry. n = 3. f, g In vitro binding of FAM-iRGD to non-Treg CD4 + CD25 neg T cells (blue line) and CD4 + CD25 + Tregs (red line) isolated from the PDAC tissue ( f ) or the spleen ( g ) of KPC-derived orthotopic PDAC mice. The bar diagrams summarize the MFI from 4 independent experiments. h Representative confocal images of Foxp3 + T cells (red) in the PDAC tissue of KPC-derived orthotopic PDAC mice that received an intravenous injection of FAM-iRGD (green). Blue, DAPI. Arrows indicate Tregs positive for iRGD. The boxed area is magnified. Scale bars, 20 μm. Statistical analyses; Mann-Whitney U test ( a , c , f , g ), Welch’s t test ( b , e ), and one sample Wilcoxon signed rank test ( d ); p = 0.0286 ( a , top), p = 0.3429 ( a , bottom), p = 0.0058 ( b , top), p = 0.0086 ( b , bottom), p = 0.0017 ( c ), p = 0.7272 ( d , 0.3), p = 0.1766 ( d , 1.0), p = 0.0052 ( d , 3.0), p = 0.0087 ( e , top), p = 0.6583 ( e , bottom), p = 0.0286 ( f ), p = 0.6857 ( g ). Error bars, mean ± standard error; * p < 0.05; ** p < 0.01; N.S., not significant.

Journal: bioRxiv

Article Title: Tumor-resident regulatory T cells in pancreatic cancer express the αvβ5 integrin as a targetable activation marker

doi: 10.1101/2023.05.24.542137

Figure Lengend Snippet: a-e CD4 + T cells isolated from the spleens of healthy C57B6129SF1/J hybrid mice were expanded for 3 days in vitro in the presence of KPC-derived PDAC cells. Flow cytometry was performed for subsequent analyses. ( a ) Expression of αvβ5 integrin and NRP-1 on CD4 + CD25 + Tregs expanded with or without the PDAC cells. n = 4 per group. ( b ) Expression of αvβ5 integrin and NRP-1 on CD4 + CD25 + Tregs and non-Treg CD4 + CD25 neg T cells expanded with the PDAC cells. n = 3 per group. ( c ) FAM-iRGD binding to the non-Tregs (blue line) and Tregs (red line) shown in ( b ). The bar diagram summarizes the median fluorescence intensity (MFI) from 4 independent experiments. ( d ) Dose-dependent inhibition of FAM-iRGD binding by an anti-αvβ5 integrin blocking Ab to Tregs that were expanded in the presence of PDAC cells. Values were normalized against isotype control. n = 3 per group. Statistical analysis was performed between the isotype control and anti-αvβ5 integrin values. ( e ) Tregs and non-Tregs were expanded in the presence of PDAC cells with or without iRGD. Apoptosis was quantified by measuring annexin V and 7-AAD double positive cells by flow cytometry. n = 3. f, g In vitro binding of FAM-iRGD to non-Treg CD4 + CD25 neg T cells (blue line) and CD4 + CD25 + Tregs (red line) isolated from the PDAC tissue ( f ) or the spleen ( g ) of KPC-derived orthotopic PDAC mice. The bar diagrams summarize the MFI from 4 independent experiments. h Representative confocal images of Foxp3 + T cells (red) in the PDAC tissue of KPC-derived orthotopic PDAC mice that received an intravenous injection of FAM-iRGD (green). Blue, DAPI. Arrows indicate Tregs positive for iRGD. The boxed area is magnified. Scale bars, 20 μm. Statistical analyses; Mann-Whitney U test ( a , c , f , g ), Welch’s t test ( b , e ), and one sample Wilcoxon signed rank test ( d ); p = 0.0286 ( a , top), p = 0.3429 ( a , bottom), p = 0.0058 ( b , top), p = 0.0086 ( b , bottom), p = 0.0017 ( c ), p = 0.7272 ( d , 0.3), p = 0.1766 ( d , 1.0), p = 0.0052 ( d , 3.0), p = 0.0087 ( e , top), p = 0.6583 ( e , bottom), p = 0.0286 ( f ), p = 0.6857 ( g ). Error bars, mean ± standard error; * p < 0.05; ** p < 0.01; N.S., not significant.

Article Snippet: After removing dead cells with a Dead Cell Removal kit (Miltenyi Biotec), the cells were treated with a PE-conjugated anti-CD25 Ab (Miltenyi Biotec), PE-conjugated anti-CCR8 Ab (eBioscience), and/or Alexa Fluor ® 647-conjugated anti-β5 integrin Ab (clone ALULA; BD Biosciences) combined with an anti-PE or -AF647 magnetic separation technique (Miltenyi Biotec) to enrich for CCR8 + iTregs, αvβ5 integrin + CCR8 + iTregs, or αvβ5 integrin neg CCR8 + iTregs.

Techniques: Isolation, In Vitro, Derivative Assay, Flow Cytometry, Expressing, Binding Assay, Fluorescence, Inhibition, Blocking Assay, Injection, MANN-WHITNEY

Naïve CD4 + T cells were isolated from the spleens of healthy C57B6129SF1/J hybrid mice by magnetically removing CD4 neg T cells and CD25 + T cells. The pool enriched for naïve CD4 + T cells was cultured in vitro with anti-CD3/CD28 Abs in the presence or absence of TGF-β1 for 3 days, and analyzed for αvβ5 integrin and NRP-1 expression by flow cytometry. ( Top row) Naïve CD4 + T cells (blue box) enriched from mouse splenocytes. A minor population of CD4 + Foxp3 + T cells was present (red box). ( Middle row ) Treating the pool in the top row with anti-CD3/CD28 Abs and TGF-β1 yielded approximately 40% of CD4 + Foxp3 + T cells (red box) and 56% of CD4 + Foxp3 neg T cells (blue box). ( Bottom row ) Treating the pool in the top row with anti-CD3/CD28 Abs alone did not change the proportion of the CD4 + T cells. Nearly 95% of the cells remained negative for Foxp3 (blue box). Representative dot plots showing the proportion of CD4 + Foxp3 + T cells (left panels) and the expression of αvβ5 integrin and NRP-1 on the indicated population are presented. The bar diagrams summarize the proportion of αvβ5 + cells in the indicated population. n = 3 per study. Statistical analysis, Welch’s t test; p = 0.4115 (top), p = 0.0013 (middle), p = 0.0032 (bottom). Error bars, mean ± standard error; ** p < 0.01; N.S., not significant.

Journal: bioRxiv

Article Title: Tumor-resident regulatory T cells in pancreatic cancer express the αvβ5 integrin as a targetable activation marker

doi: 10.1101/2023.05.24.542137

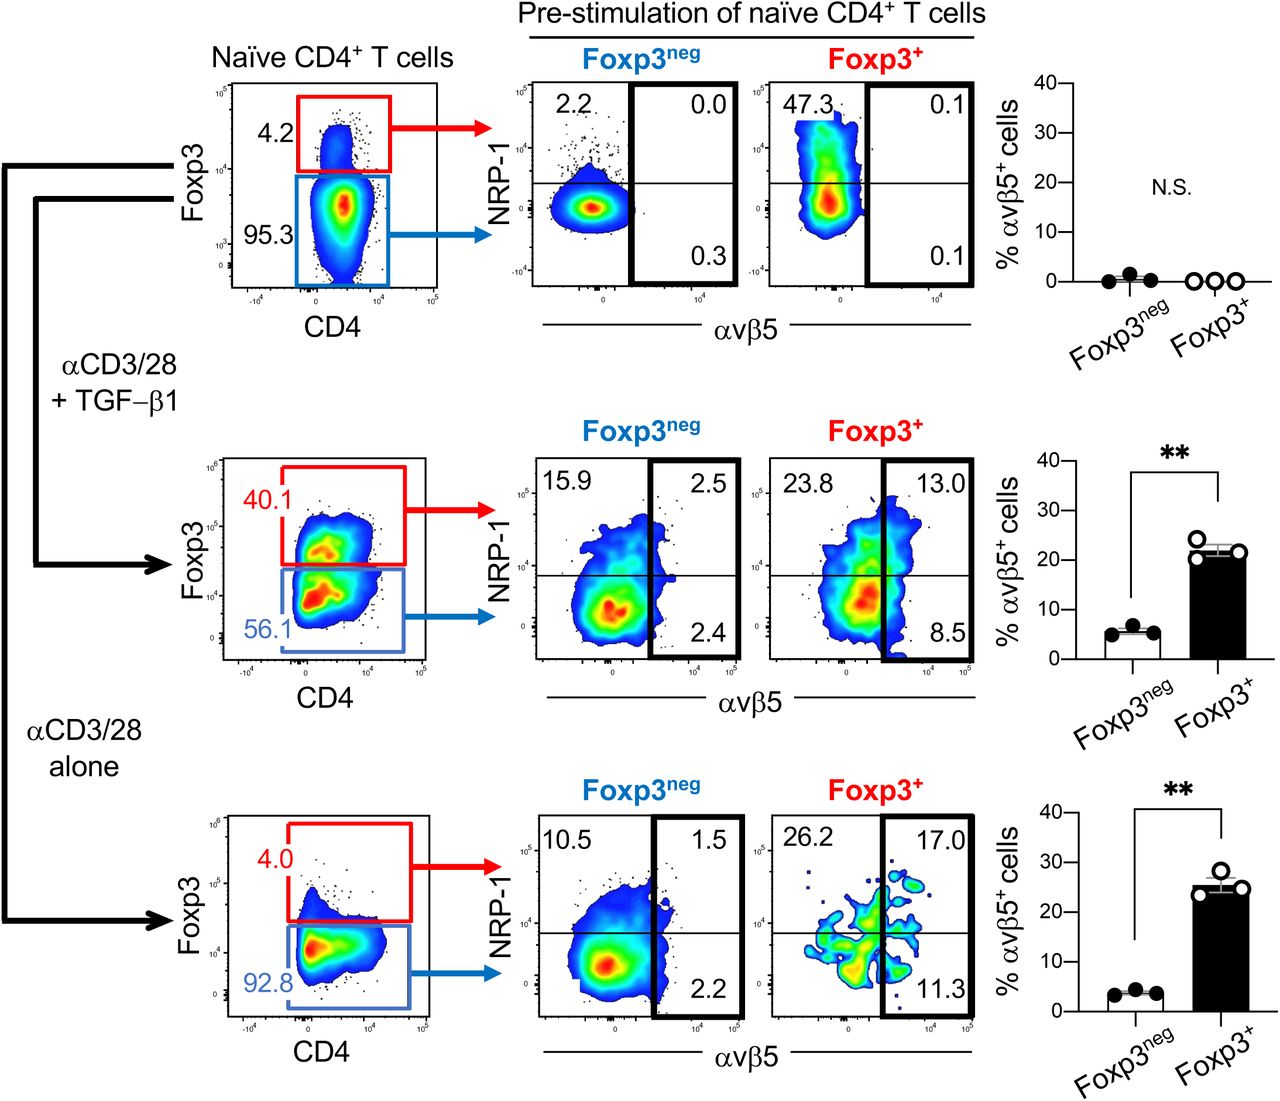
Figure Lengend Snippet: Naïve CD4 + T cells were isolated from the spleens of healthy C57B6129SF1/J hybrid mice by magnetically removing CD4 neg T cells and CD25 + T cells. The pool enriched for naïve CD4 + T cells was cultured in vitro with anti-CD3/CD28 Abs in the presence or absence of TGF-β1 for 3 days, and analyzed for αvβ5 integrin and NRP-1 expression by flow cytometry. ( Top row) Naïve CD4 + T cells (blue box) enriched from mouse splenocytes. A minor population of CD4 + Foxp3 + T cells was present (red box). ( Middle row ) Treating the pool in the top row with anti-CD3/CD28 Abs and TGF-β1 yielded approximately 40% of CD4 + Foxp3 + T cells (red box) and 56% of CD4 + Foxp3 neg T cells (blue box). ( Bottom row ) Treating the pool in the top row with anti-CD3/CD28 Abs alone did not change the proportion of the CD4 + T cells. Nearly 95% of the cells remained negative for Foxp3 (blue box). Representative dot plots showing the proportion of CD4 + Foxp3 + T cells (left panels) and the expression of αvβ5 integrin and NRP-1 on the indicated population are presented. The bar diagrams summarize the proportion of αvβ5 + cells in the indicated population. n = 3 per study. Statistical analysis, Welch’s t test; p = 0.4115 (top), p = 0.0013 (middle), p = 0.0032 (bottom). Error bars, mean ± standard error; ** p < 0.01; N.S., not significant.

Article Snippet: After removing dead cells with a Dead Cell Removal kit (Miltenyi Biotec), the cells were treated with a PE-conjugated anti-CD25 Ab (Miltenyi Biotec), PE-conjugated anti-CCR8 Ab (eBioscience), and/or Alexa Fluor ® 647-conjugated anti-β5 integrin Ab (clone ALULA; BD Biosciences) combined with an anti-PE or -AF647 magnetic separation technique (Miltenyi Biotec) to enrich for CCR8 + iTregs, αvβ5 integrin + CCR8 + iTregs, or αvβ5 integrin neg CCR8 + iTregs.

Techniques: Isolation, Cell Culture, In Vitro, Expressing, Flow Cytometry

a, b Naïve CD4 + T cells isolated from healthy mouse spleens were expanded in the presence of anti-CD3/CD28 Abs and TGF-β1 ( a ) or anti-CD3/CD28 Abs alone ( b ) for 3 days. The resulting populations were gated based on Foxp3 and CD25 expression (left panels). αvβ5 integrin and NRP-1 expression on Foxp3 + cells ( a , top row) and Foxp3 neg cells ( a , bottom row; b ) was analyzed by flow cytometry. The red and blue boxes gate CD25 + and CD25 neg cells, respectively. The bar diagrams summarize the proportion of αvβ5 integrin-positive cells in the indicated T cell population. n = 3. Statistical analysis, Welch’s t test; p = 0.0021 ( a , top), p = 0.0014 ( a , bottom), p < 0.0001 ( b ). c Flow cytometric analysis showing the proportion of αvβ5 integrin + cells among CD4 + CD25 + Foxp3 + iTregs induced by increasing concentrations of anti-CD3 Ab. n = 3. Statistical analysis, one-way ANOVA; p = 0.0088 (1 vs 3), p = 0.0088 (1 vs 10). d-f Naïve CD4 + T cells were stimulated with anti-CD3/CD28 Abs and TGF-β1 in the absence or presence of iRGD or iRGE. Flow cytometry was performed to quantify the proportion of CD4 + CD25 + Foxp3 + iTregs ( d ) and αvβ5 integrin + cells among the iTregs ( e ). Apoptosis of αvβ5 integrin + iTregs was quantified by measuring cleaved caspase 3 using flow cytometry ( f ). n = 3. Statistical analysis, one-way ANOVA ( d , e ) or Welch’s t test ( f ); p = 0.0042 ( d , None vs iRGD), p = 0.1774 ( d , None vs iRGE), p = 0.0027 ( e , None vs iRGD), p = 0.0529 ( e , None vs iRGE), p = 0.001 ( f ). Error bars, mean ± standard error; * p < 0.05; ** p < 0.01; **** p < 0.0001; N.S., not significant.

Journal: bioRxiv

Article Title: Tumor-resident regulatory T cells in pancreatic cancer express the αvβ5 integrin as a targetable activation marker

doi: 10.1101/2023.05.24.542137

Figure Lengend Snippet: a, b Naïve CD4 + T cells isolated from healthy mouse spleens were expanded in the presence of anti-CD3/CD28 Abs and TGF-β1 ( a ) or anti-CD3/CD28 Abs alone ( b ) for 3 days. The resulting populations were gated based on Foxp3 and CD25 expression (left panels). αvβ5 integrin and NRP-1 expression on Foxp3 + cells ( a , top row) and Foxp3 neg cells ( a , bottom row; b ) was analyzed by flow cytometry. The red and blue boxes gate CD25 + and CD25 neg cells, respectively. The bar diagrams summarize the proportion of αvβ5 integrin-positive cells in the indicated T cell population. n = 3. Statistical analysis, Welch’s t test; p = 0.0021 ( a , top), p = 0.0014 ( a , bottom), p < 0.0001 ( b ). c Flow cytometric analysis showing the proportion of αvβ5 integrin + cells among CD4 + CD25 + Foxp3 + iTregs induced by increasing concentrations of anti-CD3 Ab. n = 3. Statistical analysis, one-way ANOVA; p = 0.0088 (1 vs 3), p = 0.0088 (1 vs 10). d-f Naïve CD4 + T cells were stimulated with anti-CD3/CD28 Abs and TGF-β1 in the absence or presence of iRGD or iRGE. Flow cytometry was performed to quantify the proportion of CD4 + CD25 + Foxp3 + iTregs ( d ) and αvβ5 integrin + cells among the iTregs ( e ). Apoptosis of αvβ5 integrin + iTregs was quantified by measuring cleaved caspase 3 using flow cytometry ( f ). n = 3. Statistical analysis, one-way ANOVA ( d , e ) or Welch’s t test ( f ); p = 0.0042 ( d , None vs iRGD), p = 0.1774 ( d , None vs iRGE), p = 0.0027 ( e , None vs iRGD), p = 0.0529 ( e , None vs iRGE), p = 0.001 ( f ). Error bars, mean ± standard error; * p < 0.05; ** p < 0.01; **** p < 0.0001; N.S., not significant.

Article Snippet: After removing dead cells with a Dead Cell Removal kit (Miltenyi Biotec), the cells were treated with a PE-conjugated anti-CD25 Ab (Miltenyi Biotec), PE-conjugated anti-CCR8 Ab (eBioscience), and/or Alexa Fluor ® 647-conjugated anti-β5 integrin Ab (clone ALULA; BD Biosciences) combined with an anti-PE or -AF647 magnetic separation technique (Miltenyi Biotec) to enrich for CCR8 + iTregs, αvβ5 integrin + CCR8 + iTregs, or αvβ5 integrin neg CCR8 + iTregs.

Techniques: Isolation, Expressing, Flow Cytometry

a CD4 + CD25 + Foxp3 + T cells (nTregs) were enriched from the spleens of healthy C57B6129SF1/J hybrid mice by magnetically removing CD4 neg T cells and CD25 neg T cells. The middle two panels show the expression of αvβ5 integrin and NRP-1 on the nTregs (red box) and naïve CD4 + CD25 neg Foxp3 neg T cells (blue box) analyzed by flow cytometry. The bar diagram summarizes the proportion of αvβ5 integrin + cells among the two populations. n = 3. Statistical analysis, Welch’s t test; p = 0.4721. b The pool in ( a ) was treated with anti-CD3/CD28 Abs alone for 3 days (left panel). αvβ5 integrin and NRP-1 expression on Foxp3 + cells (top row) and Foxp3 neg cells (bottom row) was analyzed by flow cytometry. The red and blue boxes gate CD25 + and CD25 neg cells, respectively. The bar diagrams summarize the proportion of αvβ5 integrin + cells among the indicated T cell populations. n = 3. Statistical analysis, Welch’s t test; p = 0.0064 (top), p = 0.0035 (bottom). Error bars, mean ± standard error; ** p < 0.01; N.S., not significant.

Journal: bioRxiv

Article Title: Tumor-resident regulatory T cells in pancreatic cancer express the αvβ5 integrin as a targetable activation marker

doi: 10.1101/2023.05.24.542137

Figure Lengend Snippet: a CD4 + CD25 + Foxp3 + T cells (nTregs) were enriched from the spleens of healthy C57B6129SF1/J hybrid mice by magnetically removing CD4 neg T cells and CD25 neg T cells. The middle two panels show the expression of αvβ5 integrin and NRP-1 on the nTregs (red box) and naïve CD4 + CD25 neg Foxp3 neg T cells (blue box) analyzed by flow cytometry. The bar diagram summarizes the proportion of αvβ5 integrin + cells among the two populations. n = 3. Statistical analysis, Welch’s t test; p = 0.4721. b The pool in ( a ) was treated with anti-CD3/CD28 Abs alone for 3 days (left panel). αvβ5 integrin and NRP-1 expression on Foxp3 + cells (top row) and Foxp3 neg cells (bottom row) was analyzed by flow cytometry. The red and blue boxes gate CD25 + and CD25 neg cells, respectively. The bar diagrams summarize the proportion of αvβ5 integrin + cells among the indicated T cell populations. n = 3. Statistical analysis, Welch’s t test; p = 0.0064 (top), p = 0.0035 (bottom). Error bars, mean ± standard error; ** p < 0.01; N.S., not significant.

Article Snippet: After removing dead cells with a Dead Cell Removal kit (Miltenyi Biotec), the cells were treated with a PE-conjugated anti-CD25 Ab (Miltenyi Biotec), PE-conjugated anti-CCR8 Ab (eBioscience), and/or Alexa Fluor ® 647-conjugated anti-β5 integrin Ab (clone ALULA; BD Biosciences) combined with an anti-PE or -AF647 magnetic separation technique (Miltenyi Biotec) to enrich for CCR8 + iTregs, αvβ5 integrin + CCR8 + iTregs, or αvβ5 integrin neg CCR8 + iTregs.

Techniques: Expressing, Flow Cytometry

Naïve CD4 + CD25 neg Foxp3 neg T cells were magnetically isolated from the spleens of healthy C57B6129SF1/J mice. The cells were stimulated with anti-CD3/CD28 Abs and TGF-β1 for 3 days to induce CD4 + CD25 + Foxp3 + iTregs. a-c Expression of CCR8 and αvβ5 integrin on the T cells before and after the stimulation. Representative dot plots from 3 or 4 separate studies are shown in ( a ). The bar diagram in ( b ) summarizes the proportion of CCR8 + cells (white bars) and αvβ5 integrin + cells (black bars) among each T cell population in ( a ). The Venn diagram in ( c ) summarizes the proportion of iTregs that expressed CCR8 and/or αvβ5 integrin. d-f Treg suppression assays were performed by co-culturing iTregs and Tconv (CD4 + and CD8 + ) at a 1 : 4 ratio in the presence of anti-CD3/CD28 Abs (TCR stimulation) for 3 days. We used iTregs that were enriched for CCR8 + iTregs ( d ) or CCR8 + iTregs that were either depleted or enriched for αvβ5 integrin + cells ( e ). The expression of CCR8 and αvβ5 integrin on the iTregs is shown in the representative dot plots. Proliferation of Tconv was analyzed by flow cytometry using Cell Trace Violet as shown in the representative histograms: Shaded, iTregs + Tconv (with TCR stimulation); black solid line, Tconv alone (with TCR stimulation); black dotted line, Tconv alone (no TCR stimulation). The bar diagrams in ( f ) summarize the values from ( d ) and ( e ) normalized to stimulated Tconv alone. n = 3. Statistical analysis, one-way ANOVA; p < 0.0001 ( b , CCR8 + , CD25 neg Foxp3 neg vs CD25 + Foxp3 neg and CD25 + Foxp3 neg vs CD25 + Foxp3 + ; αvβ5 + , CD25 + Foxp3 neg vs CD25 + Foxp3 + ), p = 0.0989 ( b , αvβ5 + , CD25 neg Foxp3 neg vs CD25 + Foxp3 neg ), p = 0.0003 ( f , CD4, CCR8 + vs αvβ5 neg CCR8 + ), p = 0.0002 ( f , CD4, CCR8 + vs αvβ5 + CCR8 + ), p < 0.0001 ( f , CD4, αvβ5 neg CCR8 + vs αvβ5 + CCR8 + ), p = 0.1048 ( f , CD8, CCR8 + vs αvβ5 neg CCR8 + ), p < 0.0001 ( f , CD8, CCR8 + vs αvβ5 + CCR8 + and αvβ5 neg CCR8 + vs αvβ5 + CCR8 + ). Error bars, mean ± standard error; *** p < 0.001; **** p < 0.0001; N.S., not significant.

Journal: bioRxiv

Article Title: Tumor-resident regulatory T cells in pancreatic cancer express the αvβ5 integrin as a targetable activation marker

doi: 10.1101/2023.05.24.542137

Figure Lengend Snippet: Naïve CD4 + CD25 neg Foxp3 neg T cells were magnetically isolated from the spleens of healthy C57B6129SF1/J mice. The cells were stimulated with anti-CD3/CD28 Abs and TGF-β1 for 3 days to induce CD4 + CD25 + Foxp3 + iTregs. a-c Expression of CCR8 and αvβ5 integrin on the T cells before and after the stimulation. Representative dot plots from 3 or 4 separate studies are shown in ( a ). The bar diagram in ( b ) summarizes the proportion of CCR8 + cells (white bars) and αvβ5 integrin + cells (black bars) among each T cell population in ( a ). The Venn diagram in ( c ) summarizes the proportion of iTregs that expressed CCR8 and/or αvβ5 integrin. d-f Treg suppression assays were performed by co-culturing iTregs and Tconv (CD4 + and CD8 + ) at a 1 : 4 ratio in the presence of anti-CD3/CD28 Abs (TCR stimulation) for 3 days. We used iTregs that were enriched for CCR8 + iTregs ( d ) or CCR8 + iTregs that were either depleted or enriched for αvβ5 integrin + cells ( e ). The expression of CCR8 and αvβ5 integrin on the iTregs is shown in the representative dot plots. Proliferation of Tconv was analyzed by flow cytometry using Cell Trace Violet as shown in the representative histograms: Shaded, iTregs + Tconv (with TCR stimulation); black solid line, Tconv alone (with TCR stimulation); black dotted line, Tconv alone (no TCR stimulation). The bar diagrams in ( f ) summarize the values from ( d ) and ( e ) normalized to stimulated Tconv alone. n = 3. Statistical analysis, one-way ANOVA; p < 0.0001 ( b , CCR8 + , CD25 neg Foxp3 neg vs CD25 + Foxp3 neg and CD25 + Foxp3 neg vs CD25 + Foxp3 + ; αvβ5 + , CD25 + Foxp3 neg vs CD25 + Foxp3 + ), p = 0.0989 ( b , αvβ5 + , CD25 neg Foxp3 neg vs CD25 + Foxp3 neg ), p = 0.0003 ( f , CD4, CCR8 + vs αvβ5 neg CCR8 + ), p = 0.0002 ( f , CD4, CCR8 + vs αvβ5 + CCR8 + ), p < 0.0001 ( f , CD4, αvβ5 neg CCR8 + vs αvβ5 + CCR8 + ), p = 0.1048 ( f , CD8, CCR8 + vs αvβ5 neg CCR8 + ), p < 0.0001 ( f , CD8, CCR8 + vs αvβ5 + CCR8 + and αvβ5 neg CCR8 + vs αvβ5 + CCR8 + ). Error bars, mean ± standard error; *** p < 0.001; **** p < 0.0001; N.S., not significant.

Article Snippet: After removing dead cells with a Dead Cell Removal kit (Miltenyi Biotec), the cells were treated with a PE-conjugated anti-CD25 Ab (Miltenyi Biotec), PE-conjugated anti-CCR8 Ab (eBioscience), and/or Alexa Fluor ® 647-conjugated anti-β5 integrin Ab (clone ALULA; BD Biosciences) combined with an anti-PE or -AF647 magnetic separation technique (Miltenyi Biotec) to enrich for CCR8 + iTregs, αvβ5 integrin + CCR8 + iTregs, or αvβ5 integrin neg CCR8 + iTregs.

Techniques: Isolation, Expressing, Flow Cytometry

(A-F) Effects of inhibiting αv integrin function with siRNA knockdown (A and B or)specific monoclonal antibodies (C-F) and on the endocytosis (A, C, D) and cell-association (B, E, F) of serum-coated C . glabrata . (G and H) Inhibition of gC1qR (with monoclonal antibody 74.5.2) and αv integrins has an additive effect on decreasing the endocytosis (G) but not cell-association of serum-coated C . glabrata (H). Results are the mean ± SD of 3 experiments, each performed in triplicate. Orgs/HPF, organisms per high power field; ns, not significant; * P < 0.05, ** P < 0.01, *** P < 0.001, **** P < 0.0001 by ANOVA with the Dunnett’s test for multiple comparisons (A, B, G, H) or the Student’s t-test (C-F).

Journal: PLoS Pathogens

Article Title: Serum bridging molecules drive candidal invasion of human but not mouse endothelial cells

doi: 10.1371/journal.ppat.1010681

Figure Lengend Snippet: (A-F) Effects of inhibiting αv integrin function with siRNA knockdown (A and B or)specific monoclonal antibodies (C-F) and on the endocytosis (A, C, D) and cell-association (B, E, F) of serum-coated C . glabrata . (G and H) Inhibition of gC1qR (with monoclonal antibody 74.5.2) and αv integrins has an additive effect on decreasing the endocytosis (G) but not cell-association of serum-coated C . glabrata (H). Results are the mean ± SD of 3 experiments, each performed in triplicate. Orgs/HPF, organisms per high power field; ns, not significant; * P < 0.05, ** P < 0.01, *** P < 0.001, **** P < 0.0001 by ANOVA with the Dunnett’s test for multiple comparisons (A, B, G, H) or the Student’s t-test (C-F).

Article Snippet: For the cells transduced with hC1QBP, 10 μg/ml of blasticidin (Gibco; # A1113903) was added to the medium 2 d post transduction to select for transduced cells and selection was maintained for 7 d. Expression of eGFP was determined by fluorescent microscopy and expression of gC1qR, integrin αv, and integrin β5 were verified via immunoblotting of whole cell lysates with an anti-gC1qR antibody (clone 60.11), anti- integrin αv antibody (MilliporeSigma; #AB1930), and anti- integrin β5 antibody (My Biosource, Inc; # MBS617750).

Techniques: Inhibition

(A and B) Endocytosis of C . glabrata coated with either human or mouse serum by the indicated endothelial cells after 45 min (A) and 180 min (B). (C) Endocytosis of C . glabrata coated with fresh human serum by mouse liver endothelial cells expressing human gC1qR, integrin αv, or integrin β5. Data are the mean ± SD of 3 experiments each performed in triplicate. HUVEC, human umbilical vein endothelial cell; orgs/HPF, organisms per high power field; ns, not significant; ** P < 0.01, **** P < 0.0001. *** P < 0.001, **** P < 0.0001 by ANOVA with the Dunnett’s test for multiple comparisons.

Journal: PLoS Pathogens

Article Title: Serum bridging molecules drive candidal invasion of human but not mouse endothelial cells

doi: 10.1371/journal.ppat.1010681

Figure Lengend Snippet: (A and B) Endocytosis of C . glabrata coated with either human or mouse serum by the indicated endothelial cells after 45 min (A) and 180 min (B). (C) Endocytosis of C . glabrata coated with fresh human serum by mouse liver endothelial cells expressing human gC1qR, integrin αv, or integrin β5. Data are the mean ± SD of 3 experiments each performed in triplicate. HUVEC, human umbilical vein endothelial cell; orgs/HPF, organisms per high power field; ns, not significant; ** P < 0.01, **** P < 0.0001. *** P < 0.001, **** P < 0.0001 by ANOVA with the Dunnett’s test for multiple comparisons.

Article Snippet: For the cells transduced with hC1QBP, 10 μg/ml of blasticidin (Gibco; # A1113903) was added to the medium 2 d post transduction to select for transduced cells and selection was maintained for 7 d. Expression of eGFP was determined by fluorescent microscopy and expression of gC1qR, integrin αv, and integrin β5 were verified via immunoblotting of whole cell lysates with an anti-gC1qR antibody (clone 60.11), anti- integrin αv antibody (MilliporeSigma; #AB1930), and anti- integrin β5 antibody (My Biosource, Inc; # MBS617750).

Techniques: Expressing

CaFak and integrin-like receptors colocalize into the focal adhesions in C. albicans yeast cells adherent to VN. Confocal laser-scanning microscopy analysis on permeabilized C. albicans yeast cells with anti-Fak COOH, anti-αv, anti-β3, or anti-β5 integrin rabbit antiserum or anti-Fak NH2 mouse MAb as the primary Ab and FITC-GAR and Texas Red-GAM as second-step Abs. Panels: 3 and 5, C. albicans yeast cells on a bright field; 1 and 2, C. albicans yeast cells incubated with Texas Red-GAM or FITC-GAR, respectively; 4, C. albicans yeast cells stained with anti-Fak COOH and FITC-GAR; 6, merge of images in panels 4 and 5; 7, 10, and 13, C. albicans yeast cells stained with anti-Fak NH2 MAb and Texas Red-GAM; C. albicans yeast cells stained with anti-αv (panel 8), anti-β3 (panel 11), or anti-β5 integrin (panel 14) Ab and FITC-GAR, respectively; 9, 12, and 15, merge of images in panels 7 and 8, 10 and 11, and 13 and 14, respectively. The results are representative of one of three separate experiments. White arrows indicate CaFak localization at focal adhesion sites. Bar, 1 μm.

Journal:

Article Title: Candida albicans Expresses a Focal Adhesion Kinase-Like Protein That Undergoes Increased Tyrosine Phosphorylation upon Yeast Cell Adhesion to Vitronectin and the EA.hy 926 Human Endothelial Cell Line

doi: 10.1128/IAI.70.7.3804-3815.2002

Figure Lengend Snippet: CaFak and integrin-like receptors colocalize into the focal adhesions in C. albicans yeast cells adherent to VN. Confocal laser-scanning microscopy analysis on permeabilized C. albicans yeast cells with anti-Fak COOH, anti-αv, anti-β3, or anti-β5 integrin rabbit antiserum or anti-Fak NH2 mouse MAb as the primary Ab and FITC-GAR and Texas Red-GAM as second-step Abs. Panels: 3 and 5, C. albicans yeast cells on a bright field; 1 and 2, C. albicans yeast cells incubated with Texas Red-GAM or FITC-GAR, respectively; 4, C. albicans yeast cells stained with anti-Fak COOH and FITC-GAR; 6, merge of images in panels 4 and 5; 7, 10, and 13, C. albicans yeast cells stained with anti-Fak NH2 MAb and Texas Red-GAM; C. albicans yeast cells stained with anti-αv (panel 8), anti-β3 (panel 11), or anti-β5 integrin (panel 14) Ab and FITC-GAR, respectively; 9, 12, and 15, merge of images in panels 7 and 8, 10 and 11, and 13 and 14, respectively. The results are representative of one of three separate experiments. White arrows indicate CaFak localization at focal adhesion sites. Bar, 1 μm.

Article Snippet: The following rabbit polyclonal Abs were used: antiserum directed to the COOH domain of chicken Fak (anti-Fak COOH), antiserum directed against an intracytoplasmic domain of the human β3 integrin, and antiserum directed to the COOH domain of the human αv integrin (kindly provided by Guido Tarone), antiserum to a COOH-terminal sequence of the human β5 integrin (Bioline Diagnostic, Turin, Italy), and anti-human VN Ab (Gibco-BRL).

Techniques: Confocal Laser Scanning Microscopy, Incubation, Staining

Engagement of αvβ3 and αvβ5 integrin-like VNRs on C. albicans yeast cells stimulates CaFak tyrosine phosphorylation. C. albicans yeast cells were left untreated (time zero) or stimulated for the indicated times at 37°C with mouse anti-αvβ3 (LM609) (A), anti-αvβ5 (P1F6) (B), or anti-GMP (GF2) control MAb (C). Cell lysates were immunoprecipitated with an anti-Fak COOH rabbit polyclonal Ab. The resulting protein complexes were resolved by SDS-7% polyacrylamide gel electrophoresis, transferred to polyvinylidene difluoride membrane, and immunoblotted with anti-pTyr (4G10) (top panel) or anti-Fak NH2 MAb (bottom panel). Lanes 1, 3, 5, and 7 represent normal rabbit serum immunoprecipitates used as negative control. The results shown are representative of one of three separate experiments. As evaluated by densitometric analysis, upon αvβ3 stimulation, a 0.7-fold increase of CaFak tyrosine phosphorylation was observed at 10 min, a 5-fold increase was observed at 30 min, a 0.5-fold increase was observed at 60 min and upon αvβ5 stimulation, a 1.2-fold increase of CaFak tyrosine phosphorylation was observed at 10 min, a 5-fold increase was observed at 30 min, and a 0.3-fold increase was observed at 60 min.

Journal:

Article Title: Candida albicans Expresses a Focal Adhesion Kinase-Like Protein That Undergoes Increased Tyrosine Phosphorylation upon Yeast Cell Adhesion to Vitronectin and the EA.hy 926 Human Endothelial Cell Line

doi: 10.1128/IAI.70.7.3804-3815.2002

Figure Lengend Snippet: Engagement of αvβ3 and αvβ5 integrin-like VNRs on C. albicans yeast cells stimulates CaFak tyrosine phosphorylation. C. albicans yeast cells were left untreated (time zero) or stimulated for the indicated times at 37°C with mouse anti-αvβ3 (LM609) (A), anti-αvβ5 (P1F6) (B), or anti-GMP (GF2) control MAb (C). Cell lysates were immunoprecipitated with an anti-Fak COOH rabbit polyclonal Ab. The resulting protein complexes were resolved by SDS-7% polyacrylamide gel electrophoresis, transferred to polyvinylidene difluoride membrane, and immunoblotted with anti-pTyr (4G10) (top panel) or anti-Fak NH2 MAb (bottom panel). Lanes 1, 3, 5, and 7 represent normal rabbit serum immunoprecipitates used as negative control. The results shown are representative of one of three separate experiments. As evaluated by densitometric analysis, upon αvβ3 stimulation, a 0.7-fold increase of CaFak tyrosine phosphorylation was observed at 10 min, a 5-fold increase was observed at 30 min, a 0.5-fold increase was observed at 60 min and upon αvβ5 stimulation, a 1.2-fold increase of CaFak tyrosine phosphorylation was observed at 10 min, a 5-fold increase was observed at 30 min, and a 0.3-fold increase was observed at 60 min.

Article Snippet: The following rabbit polyclonal Abs were used: antiserum directed to the COOH domain of chicken Fak (anti-Fak COOH), antiserum directed against an intracytoplasmic domain of the human β3 integrin, and antiserum directed to the COOH domain of the human αv integrin (kindly provided by Guido Tarone), antiserum to a COOH-terminal sequence of the human β5 integrin (Bioline Diagnostic, Turin, Italy), and anti-human VN Ab (Gibco-BRL).

Techniques: Immunoprecipitation, Polyacrylamide Gel Electrophoresis, Negative Control